The Mira App: How to read E3G results?
First things first: what is E3G?
E3G is a metabolite of estradiol (E2), a type of estrogen found in urine. Its primary role is to signal that a follicle is grown, developed, and ready to release an egg. This then helps stimulate a surge in luteinizing hormone (LH), which triggers ovulation.

Simply put: you need to monitor this hormone early on in your cycle in order to pinpoint ovulation and identify your 6-day fertile window.
E3G levels rise approximately 1-3 days before an LH surge. Its rise often overlaps with the start of the fertile window.
After ovulation, E3G levels will drop. However, there will be another small surge in E3G in the middle of the luteal phase (i.e. the period of time after ovulation but before your period). This is a sign that the corpus luteum is working properly and can support potential implantation. At the same time, it also indicates that the body is in an infertile period.
What is a normal E3G range?
Our E3G levels fluctuate from individual to individual and cycle to cycle.
Generally, it will be up to 120 ng/mL during the follicular phase and rise up to 120-640+ ng/mL when close to ovulation. Because of the self-regulating effect of estrogen, the rise of E3G when close to ovulation fluctuates.
Average Ranges for E3G hormone are:
| Follicular phase | Ovulatory phase | Luteal phase | |
| 80-120 ng/mL | 120 – 400 ng/mL | 100-350 ng/mL |
Is testing E3G the same as Estradiol blood testing?
Estradiol (also known as E2) is found in your blood, and its metabolized product is E3G (estrone-3-glucuronide) which is found in urine. It’s important to note that they do not share the same unit of measurement; the unit for E3G is ng/mL, whereas the unit for E2 is pg/mL.
While E3G and E2 are different, they do share the same fluctuation patterns. This is why we can measure E3G in urine to track estradiol (E2) fluctuations.
How can I check if my E3G levels are normal?

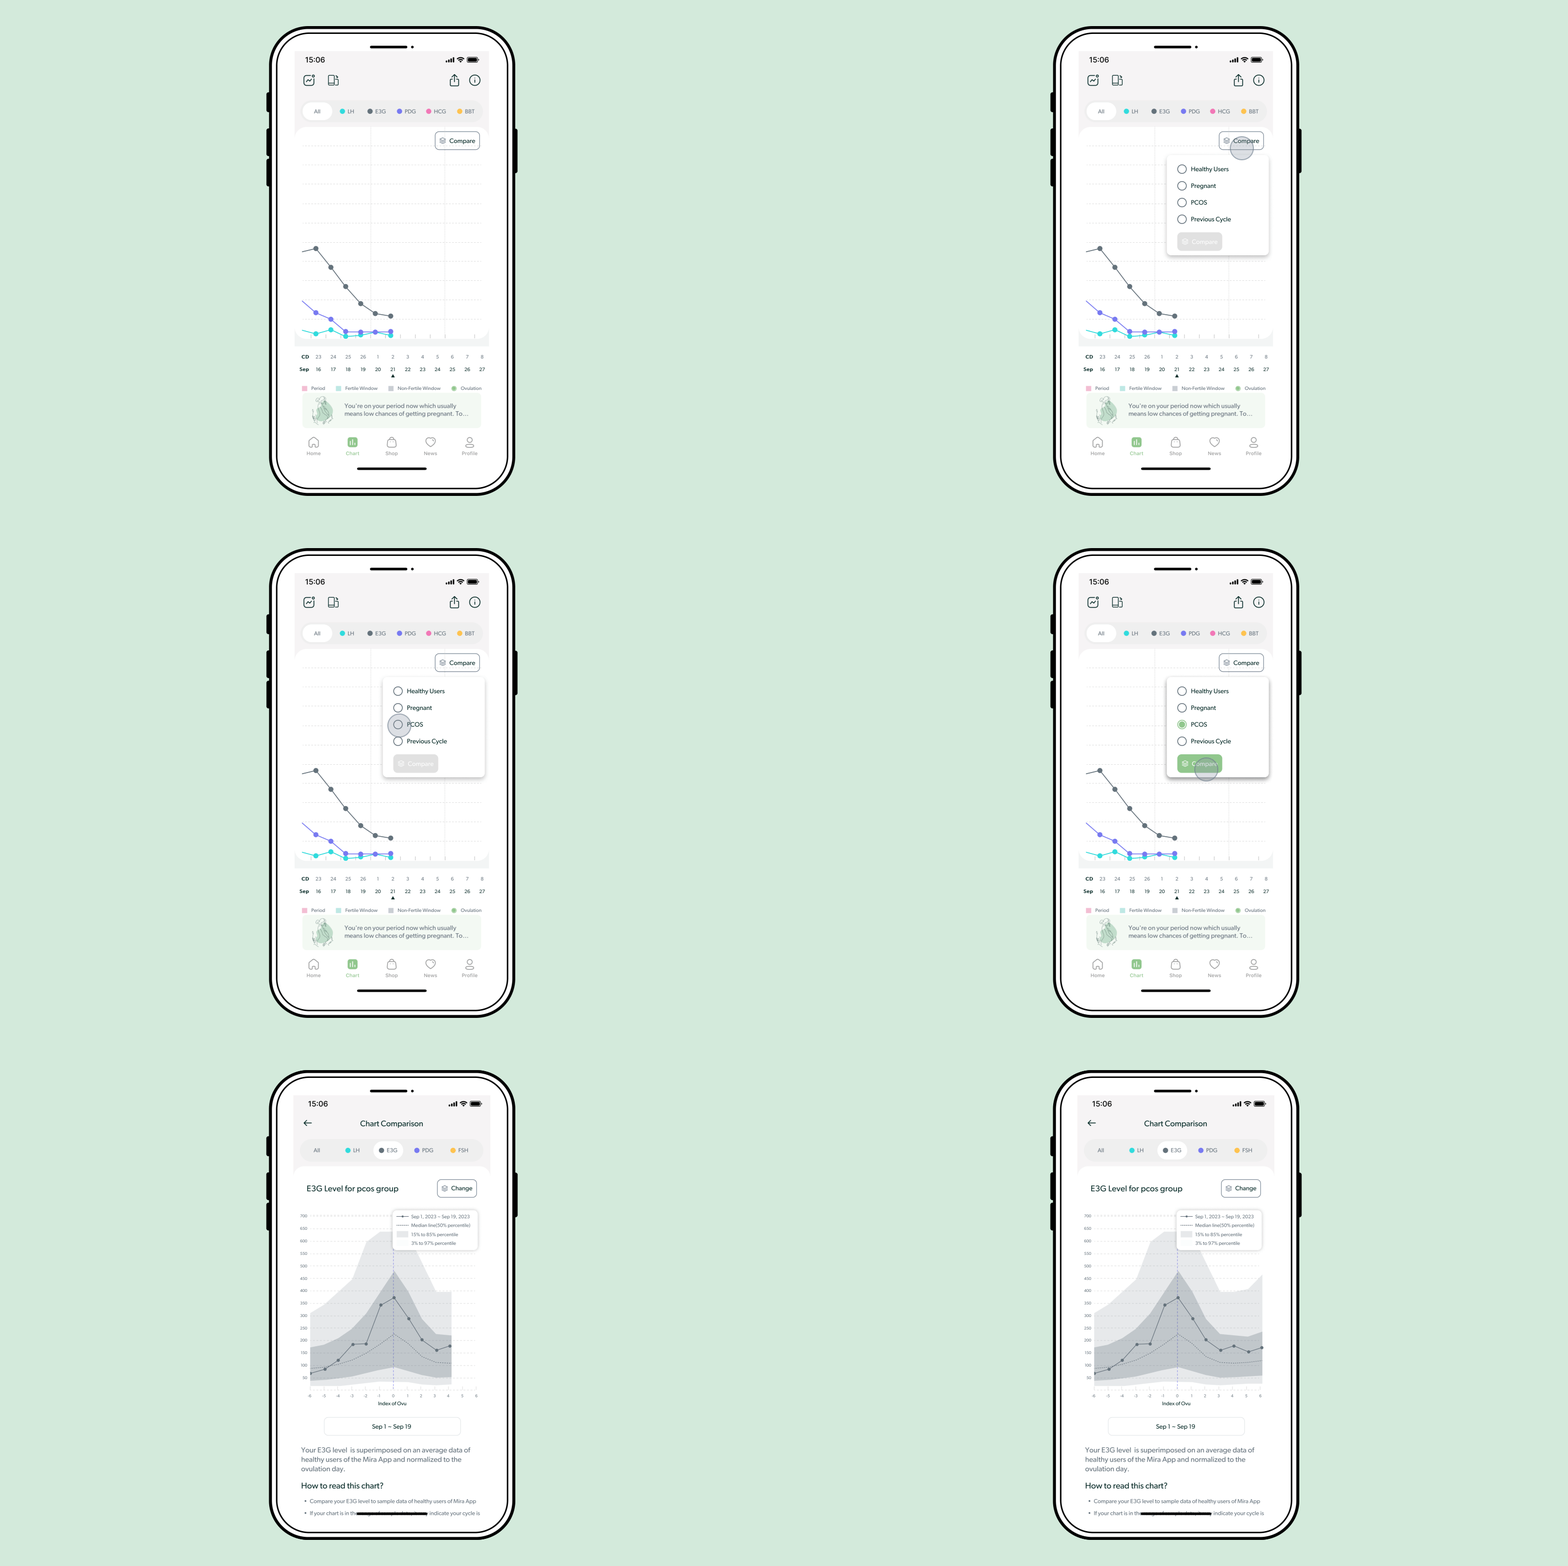
In the Mira App, you can visually compare your charts with other people’s average charts – this can help you see if your chart is in range or out of range.
- How? Go to the Charts page. Click on the ‘E3G’ name of the hormone on the top of the screen. Choose who you want to compare your charts with: Healthy users, Pregnant, or PCOS segment.
You can also check what typical E3G charts look like and how to read them. We created an educational section with common examples and short interpretations.
- How? Go to the Charts page. Click the “!” icon on the top right corner of the charts screen.
In doubt about your E3G values on the Mira app? Remember that you can always share your results with one of our certified Fertility Coaches. They will help you understand your Mira charts.
Disclaimer: Fertility coaches do not provide diagnoses, treatment, or medication prescriptions. Our services are designed to offer education, promote well-being, and extend emotional support. Fertility coaches do not have access to your Mira results. You will be required to upload your Mira results prior to your appointment.

A little extra support from an expert can go a long way
Book an online consultation with one of our Hormone Health Coaches.
Schedule NowNow you can read:
Mira’s Editorial Process
All content produced by Mira meets stringent editorial standards, ensuring excellence and accuracy in language and medical precision. Every piece undergoes thorough fact-checking and review by qualified professionals. Check out our full editorial process to learn more.


